
In economic development, we can understand the distribution and project lead details to support investment choices and foster further growth. These insights will not only help businesses and investors identify potential opportunities but also enable policymakers to tailor their strategies to meet the evolving needs of different regions and sectors. By aligning development plans with these insights, we can foster stronger, more resilient economies that are adaptable to changing market conditions.
Please see below key data points that offer a detailed overview of project leads by state, building size requirements, acreage needs, and industry. We’ll also examine emerging trends.
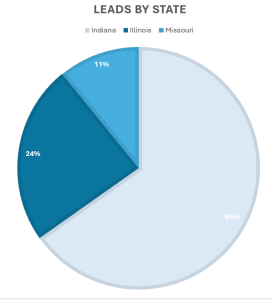
Project Leads by State:
Analyzing project leads by state offers a snapshot of economic activity across communities served by our member cooperatives. This breakdown helps identify which states are seeing the most interest in new projects and can guide resource allocation and strategic planning. In Q3 2025 we submitted 46 leads, this truly shows how busy our communities have been with project leads.
- 30 leads solely interested in Indiana
- 11 leads solely interested in Illinois
- 4 leads solely interested in Missouri
- 1 lead interested in Missouri, Indiana, and Illinois
- 46 total leads submitted in the quarter
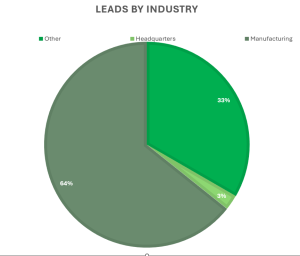
Projects by Industry:
Understanding the distribution of project leads by industry helps to identify economic trends and sector growth patterns. WVPA communities received 27 leads in the manufacturing industry, which left our team and our member communities amazed. We also received leads in other industries.
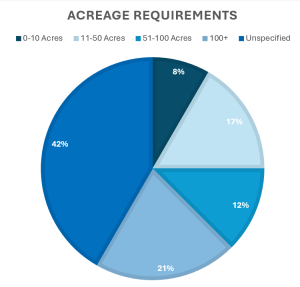
Acreage Requirements
Project leads vary significantly based on the acreage requirements, reflecting diverse types of developments and their spatial needs. In the 3rd quarter, the most requested acreage size was unknown; we received 20 projects submitted that lacked a specific acreage requirement.
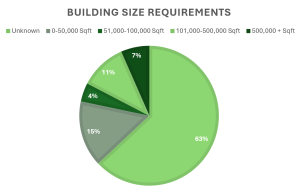
Building Size
The scale of buildings required for projects provides insight into the nature and scope of these developments. Knowing this information can help prepare our communities for future growth. In the 3rd quarter, the most submitted building size requirement was between 0-50,000 SF, though many (29) projects lacked a specific building size requirement.
To wrap up Q3, our team received 46 new project leads, double the number of leads from the previous quarter and indicative of a a strong regional interest in the Midwest. Each lead represents potential investment, job creation, and growth opportunities for our communities.
These results reflect the continued collaboration between our economic development team, local partners, and distribution cooperatives to position our regions for long-term success. We look forward to building on this momentum as we move into the final quarter of the year.